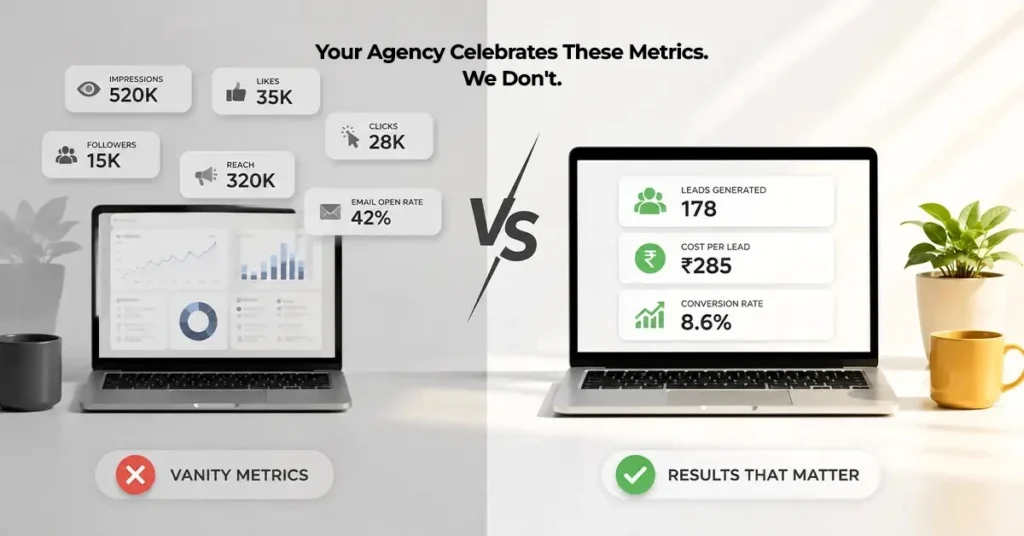
Your monthly marketing report looks impressive.
Reach is up 42%. Impressions crossed one million. Click-through rate improved. Website traffic is growing. The charts are moving in the right direction.
But there is one question that matters more than all of them:
How much business did your marketing actually generate?
This is where marketing reports often become misleading. Agencies and brands can spend hours discussing impressions, clicks and engagement while the metrics that directly affect revenue get very little attention.
Reach and clicks are not useless. They help you understand whether your campaigns are getting attention. But attention is not the same as business.
If the objective is lead generation, sales or revenue growth, your marketing performance needs to be measured further down the funnel.
Here are the numbers we would pay closer attention to.
Reach tells you how many unique people were exposed to your content or advertisement. It is useful when brand awareness is the objective, but it does not tell you how many people are interested in buying.
A campaign reaching 500,000 people may look better than one reaching 50,000. But if the smaller campaign generates 100 qualified leads while the larger campaign generates 20, which one actually performed better?
That depends on the business objective, not the size of the number.
Reach should provide context. It should not become the headline metric when the goal is sales.
Impressions tell you how many times your ad was displayed. They can help evaluate media delivery and frequency, but a high impression count does not automatically mean high marketing performance.
One person seeing your ad five times creates five impressions. None of those impressions guarantee an enquiry or purchase.
This is why we prefer looking beyond delivery metrics and asking what happened after the impression.
Did people visit the website? Did they enquire? Were those enquiries relevant? Did any become sales?
That is where the real story starts.
Getting people to click an ad feels like progress, and it is. But a click only tells you that someone showed enough interest to visit the next stage.
It does not tell you whether they were the right customer.
A campaign can generate thousands of clicks and still produce very little business if the targeting is broad, the landing page is weak or the traffic has low purchase intent.
Instead of asking only “How many clicks did we get?”, ask:
How many of those clicks turned into meaningful actions?
That could be a lead form submission, phone call, booking, enquiry or purchase, depending on your business.
Click-through rate, or CTR, measures the percentage of people who clicked after seeing your ad.
A high CTR can indicate that your creative, headline or offer is attracting attention. But it does not tell you whether those clicks are converting into revenue.
For example, imagine two campaigns:
Campaign A: 5% CTR, 200 leads, 20 qualified opportunities
Campaign B: 2.5% CTR, 100 leads, 35 qualified opportunities
Campaign A has the better CTR. Campaign B may be the better business campaign.
The lesson is simple: optimise CTR in context, not in isolation.
This is one of the biggest differences between marketing reporting and actual business reporting.
Getting 500 leads sounds impressive until the sales team tells you that most of them are irrelevant.
A qualified lead has a realistic possibility of becoming a customer. The exact definition depends on your business. It could be someone who meets a budget requirement, is in the right location, has a genuine requirement or is ready to speak to sales.
Track the journey:
Leads → Qualified Leads → Sales Opportunities → Customers
This tells you far more than the total lead count.
Cost per lead is useful, but it does not tell the entire story.
Suppose Campaign A generates leads at ₹400 each and Campaign B generates them at ₹700. At first glance, Campaign A looks better.
But what if only 5% of Campaign A’s leads become genuine sales opportunities, while 20% of Campaign B’s leads do?
Your cheaper leads may actually be costing you more to acquire a real opportunity.
That is why cost per sales opportunity can be a much stronger metric for businesses with a longer sales cycle.
Conversion rate measures the percentage of visitors who complete a desired action.
That action could be:
A high-traffic website with a poor conversion rate may have a bigger problem than a smaller website converting efficiently.
For example, 10,000 visitors generating 100 leads means a 1% conversion rate. If improvements increase that to 2%, the same traffic now generates 200 leads.
You did not necessarily need more traffic. You made better use of the traffic you already had.
Eventually, marketing needs to connect with revenue.
If a campaign generates leads but none become customers, the lead count alone does not tell you whether the campaign was successful.
Revenue attribution is not always perfect, especially for businesses with long sales cycles and multiple touchpoints. But connecting marketing platforms with your CRM and sales data gives you a much clearer picture.
The conversation changes from:
“We generated 1,000 leads.”
to:
“We generated 1,000 leads, 120 qualified opportunities and ₹X in attributed revenue.”
That is a much more useful marketing report.
Return on Ad Spend, or ROAS, compares the revenue generated with the amount spent on advertising.
The basic calculation is:
ROAS = Revenue from Ads ÷ Ad Spend
If you spend ₹1 lakh and generate ₹5 lakh in attributed revenue, your ROAS is 5X.
But ROAS should also be viewed in context. A 5X ROAS may sound excellent, but if margins are low, the business may still not be profitable.
That is why ROAS is valuable, but it should not be the only financial metric you track.
Customer Acquisition Cost, or CAC, tells you how much it costs to acquire a customer.
A simple calculation is:
CAC = Total Sales & Marketing Cost ÷ Number of New Customers
Then there is Customer Lifetime Value, or LTV. Instead of looking at what a customer is worth from one transaction, LTV estimates the value they generate over the entire relationship with the business.
This creates a more useful comparison:
How much does it cost us to acquire a customer, and how much value does that customer generate?
If your CAC keeps increasing while customer lifetime value stays flat, you have a problem even if your reach and impressions are growing every month.
The answer depends on your marketing objective, business model and sales cycle. But for a performance-focused campaign, a useful dashboard could include:
| Metric | What It Tells You |
| Reach | How many people saw your campaign |
| Impressions | How often your ads were shown |
| CTR | How well your ad attracts clicks |
| Qualified Leads | How many leads have genuine potential |
| Cost Per Qualified Lead | What you’re paying for meaningful leads |
| Sales Opportunities | How many leads entered the sales process |
| Conversion Rate | How effectively traffic becomes action |
| CAC | What it costs to acquire a customer |
| Revenue | Business generated |
| ROAS | Revenue generated against ad spend |
| LTV | Long-term customer value |
The important thing is not to stop tracking reach, impressions or clicks. It is to stop treating them as proof of business success when they are not.
Marketing reports should not be designed to make campaigns look good. They should help businesses understand what is actually working.
Reach can tell you how many people saw you. CTR can tell you whether your ad attracted attention. Traffic can tell you whether people visited.
But qualified leads, sales opportunities, conversion rate, customer acquisition cost, revenue, ROAS and lifetime value tell you whether marketing is contributing to the business.
The next time someone tells you that your campaign had 2 million impressions, ask one more question:
“And how much business did those impressions create?”
Because at the end of the month, a bigger dashboard is not the goal.
Better business is.
© Digital Tokri (Ira Digital Services). All rights reserved.
 Back
Back